On December 1st I set out to see what Metabolic Efficiency Training is all about. How to train my body to burn more fat. More detail on my motivations can be found in this post, but I’ve read the book. I’ve taken a webinar on it, I’ve seen the athlete examples of what it can do. I’ve previously tried to incorporate some of the principles and I knew what it involved, I just hadn’t taken the full leap of faith to give it 100%. I mean, how can a girl who’s mom used to call her “starch mouth” cut out grains completely and reduce consumption of starchy foods? So on December 1st, with some help of Kelly Ping, RD, of the UCCS Peak Nutrition Clinic, I set off on a three week study to see what would come of it. Below I share with you how it was done and the results…
THE PLAN
- Eat only fruits, vegetables, lean protein and healthy fats
- Due to the holidays I allowed myself two “deviation” meals per week. Not to pig out, but to enjoy the treats of the holiday season.
- Eat when I’m hungry and only until I’m satisfied
- Track all my exercise and food intake in TrainingPeaks
- Get an ISAK skinfold test before and after the three week study to see if there were measurable changes
- Weigh myself on my home scale once a week for tracking purposes
- Blog about the daily food on my personal blog (it’s all there on http://bananadeath.blogspot.com/!)
- Provide summary posts here on this blog. You can review week 1 and week 2 summaries.
THE DATA
Caloric Intake:
I was not going to count calories during this study. The plan was to eat when I was hungry and only until I was satisfied. I did have an idea of how many calories I had been eating each day because I entered the foods I ate into TrainingPeaks, but didn’t use the data to determine what or how much I should eat each day. My biggest challenge regarding food was to make sure I had enough of the right foods with me at work so as to not go hungry at 4pm and feel like raiding the vending machine. I kept nuts in my desk as back-up snacks.
Here’s what the caloric intake looked like over the three weeks:
 |
| Figure 1: TrainingPeaks graph of caloric intake |
The top graph can be considered “net” calories each day. Calories minus RMR (1390 in Training Peaks) minus any calories burned from exercise. From this graph I’m averaging about a 400 calorie surplus for the first half of the study, and then probably a 300 calorie surplus. Although the “surplus” doesn’t take into account any calories burned outside of RMR and specific workouts. Because I lost about two pounds, there really was an overall calorie deficit, and on average I consumed just under 2100 calories a day. Calorie consumption was eerily consistent, and lower days tended to follow higher days. You can probably pick out the days with the holiday parties!
Can you get enough carbohydrates if you cut grains out of your diet? Let’s look at how many calories from carbohydrates, fats and proteins I consumed. When I analyzed this the first week I was a bit low on the carbohydrate intake at about 35%. Bob’s recommendation was to get it closer to 45%. I got closer in week 2 and almost there in week 3.
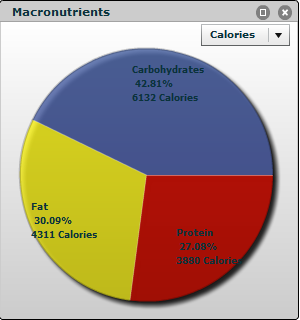 |
| Figure 2: Week 3, Dec 15 – 21, 2010 Macronutrient distribution |
Over the whole three week period of the study the distribution looks as follows:
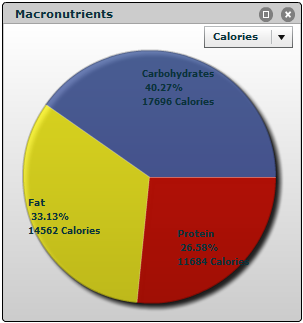 |
| Figure 3: Dec 1-21, 2010 Macronutrient distribution |
I think because I snacked on nuts often the fat percentage is a little high. Peanut butter was in my breakfast just about every day. Once I started to add a couple extra fruit servings and beans (e.g. black beans, chick peas, kidney beans) to some of the meals I bumped up the carbohydrate intake.
 |
| Figure 4: Dec 1-21, 2010 Macronutrient distribution by grams |
 |
|
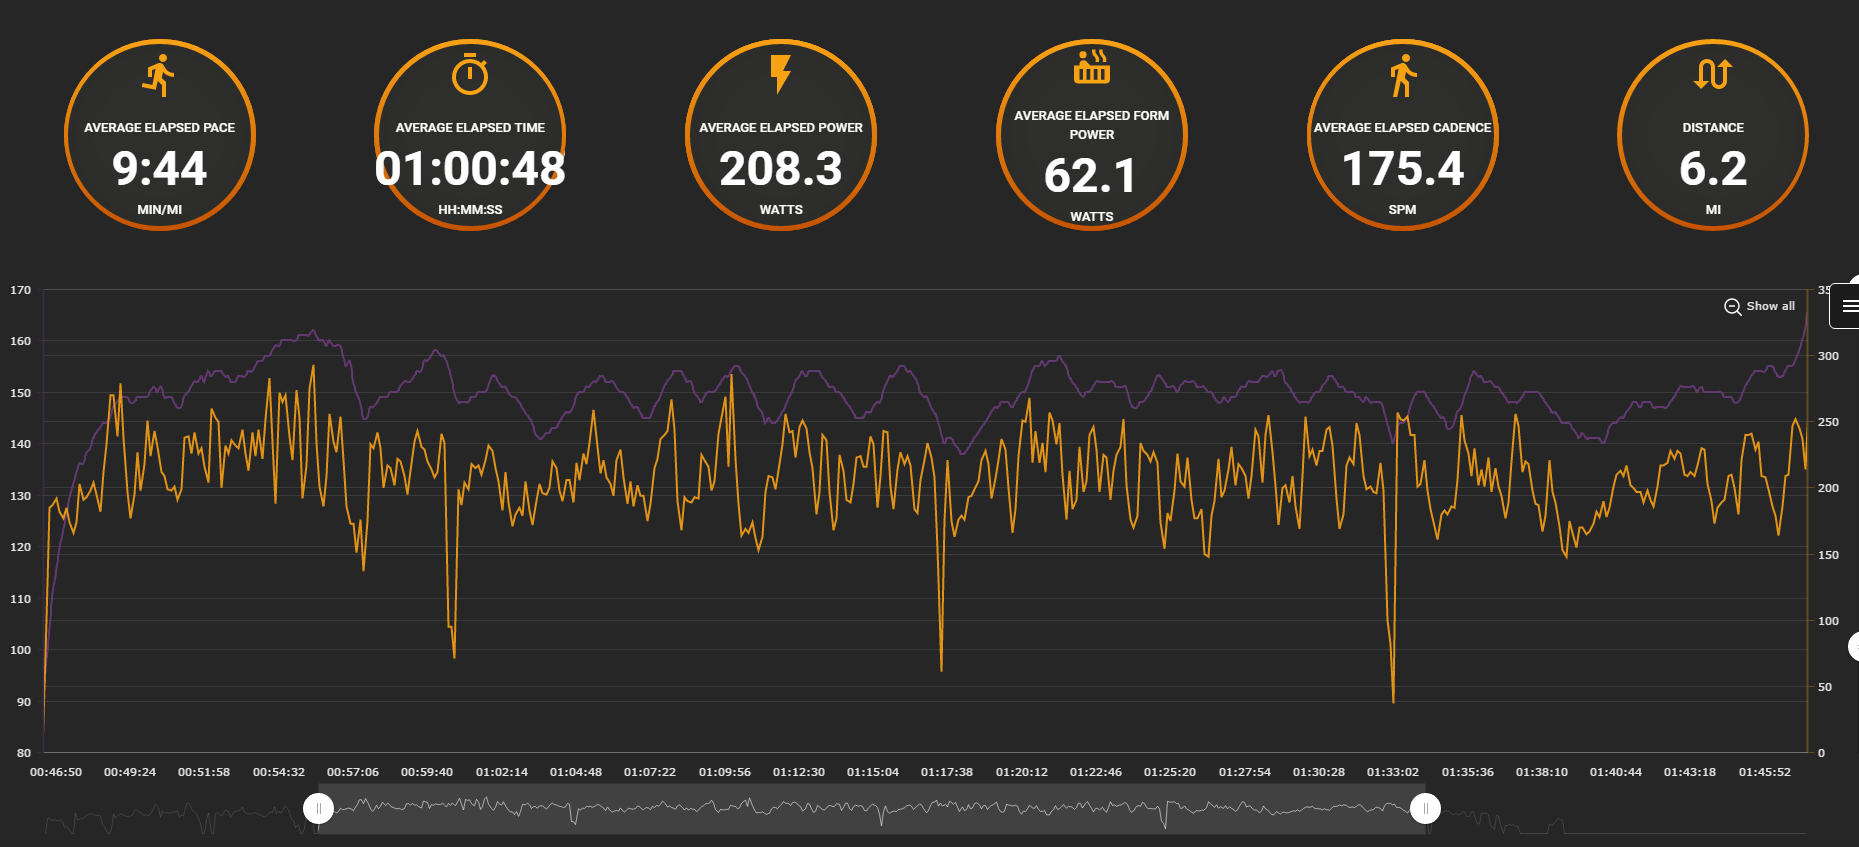
Figure 5: Dec 1-21, 2010 Exercise Summary
|
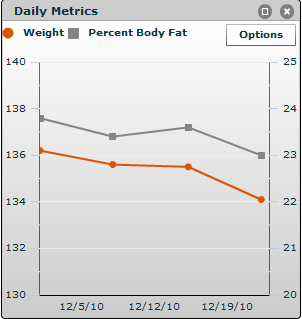 |
|
Figure 6: Graph of weekly weight on home scale
|
Final Remarks:

6 comments
Thanks for sharing this. I know many people who don't want to do the Paleo diet, but do want to burn energy more efficiently. This sounds like the perfect diet for those people.
Thanks for sharing! I'm looking forward to more following!
I have always found that when I eat more veggies to get my carbs and fewer starches my body responds better – easier to keep the weight and body fat under control. Especially when I limit night time starches. This completely reaffirms that for me and I plan to keep it up! Nice work chica!
Sunny – yes, this doesn't have quite the restrictions as Paleo, but seems to work! And when excercise intensity increases, the whole grains come back in to support that.
Nora – thanks for following!
Leslie – glad it confirms what's been working for you. And congrats again on IMAZ! 🙂
Thanks for the summary, Nicole. I followed your progress, and just ordered the book for myself and Tim. Will be interesting to see how we can incorporate it into our family eating. We're trying to make our diet cleaner without sacrificing energy. This sounds like a good place to start!
I'd love to read another post on how this has been going for you over the past few months.
Comments are closed.